Our Experts Published in La Vague, A3P's Technical Journal
13/08/2026
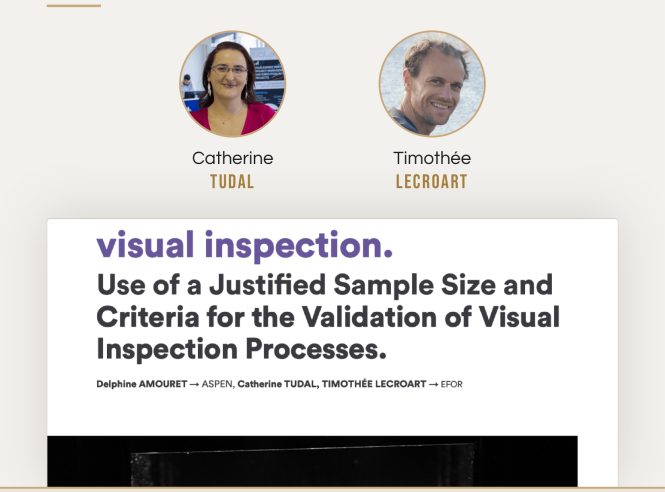
We are proud to announce the publication, in issue 91 of La Vague (July 2026), of a technical article co-authored by two Efor experts, Catherine Tudal and Timothée Lecroart, together with Delphine Amouret from Aspen. Titled “Criteria for the Validation of Visual Inspection Process,” the article addresses a question that matters to every pharmaceutical manufacturer: how to ensure that a genuinely reliable visual inspection process is validated as such — and that a process generating an unacceptable rate of non-conformities is not.
A regulatory concern of growing importance
Visual inspection is a critical quality control step for injectable and other sterile products: it is designed to detect particulate matter, container-closure defects, or other non-conformities that could affect patient safety. Its importance has been further reinforced by the revision of Annex 1 of the EU GMP guidelines and by USP <790> and <1790> on visible particulates in injections. Against this backdrop, validating the inspection process must demonstrate, with statistical rigour and in line with quality risk management principles (ICH Q9(R1)), that the process reliably detects defects — not merely satisfy a documentary checklist.
The limits of applying AQL sampling plans to validation
To define sample sizes and acceptance criteria for their validation activities, many companies still rely on attribute sampling plans from ISO 2859-1 or ANSI/ASQ Z1.4-2003, selecting a “tightened” or reinforced inspection level in the belief that this offers additional protection. As the authors point out, these standards were designed for incoming inspection or the routine sentencing of already-manufactured lots — deciding, lot by lot, whether to accept or reject a production batch — not for demonstrating, during validation, that a process is inherently capable of performing reliably. Applied as-is to a validation exercise, a reinforced AQL plan can create a false sense of security: a process generating an unacceptable proportion of non-conformities can still pass validation.
Efficiency curves: making the hidden risk of a sampling plan visible
To make this risk explicit, the article draws on efficiency curves — also known as Operating Characteristic (OC) curves — associated with each sampling plan. These curves plot the probability that a lot will be accepted as a function of its actual proportion of non-conforming units. For a given plan (n, c) — sample size n and acceptance number c — they reveal the probability that a lot containing a defect rate well above the acceptable threshold would nonetheless be accepted. This is precisely what exposes the blind spots of a sampling plan chosen off the shelf, rather than one built for its intended purpose — a reading that ISO 2859-1:2026 now formalises directly through the curve rather than through table look-up alone.
A risk-based method: the binomial distribution, producer’s risk and consumer’s risk
Rather than starting from a standard AQL table, the authors propose building the sampling plan directly from the risks one wishes to control: the producer’s risk (wrongly rejecting a well-performing process) and the consumer’s risk (wrongly accepting a process that generates too many non-conformities). Using the binomial distribution, it becomes possible to calculate, for different sample sizes and acceptance numbers, the resulting efficiency curve, and then to choose the (n, c) parameters that achieve the desired level of discrimination between an acceptable and an unacceptable process.
A concrete example based on three lots
The article illustrates this approach through a concrete example involving the validation of three lots, with explicitly defined producer’s and consumer’s risk parameters. This practical application allows for a tangible comparison between the sample sizes and acceptance criteria obtained through a risk-based approach and those resulting from a reinforced AQL plan chosen by default — highlighting the real gap in protection that can result.
An approach that extends beyond operational qualification
The authors’ recommendations are not limited to the Operational Qualification (OQ) stage: they also cover Performance Qualification / process validation (PQ) and Continued Process Verification (CPV), so that a consistent, risk-based statistical rationale is maintained throughout the entire validation lifecycle — a point increasingly scrutinised during GMP inspections, where the traceability of the statistical reasoning now matters as much as the result itself.
Efor and A3P: a long-standing partnership
This publication reflects a long-standing collaboration between Efor and A3P, Europe’s leading professional association in life sciences, bringing together more than 9,000 experts in sterile manufacturing, GMP compliance, and pharmaceutical quality through its conferences, training sessions, and quarterly journal, La Vague. Several of our experts, including Catherine Tudal, who leads A3P’s “Statistics” working group, regularly contribute to the development of technical guides and speak at industry conferences.
Congratulations to Catherine Tudal and Timothée Lecroart for this new contribution, which reflects Efor’s expertise in a regulatory environment that continues to evolve.
Need assistance?
Looking to strengthen the validation of your visual inspection processes, or more broadly to build risk-based sampling plans for your quality control activities? Efor’s statistical experts support you in defining validation strategies, designing sampling plans suited to your processes, and aligning your practices with GMP requirements.
Contact us: solutionprojectdelivery@efor-group.com
Read the full article (in English), La Vague issue 91, p. 32
Efor group
Our CSR commitments
Aware of our social and environmental responsibility, we act every day to make a positive impact on society.
Our news
Discover all our technical articles and news
-
 CSR
CSR24/09/2026
Sport and Solidarity: Team Efor Takes On Toronto and Mulhouse
Our teams laced up their running shoes for two inspiring solidarity races in support of cancer research.
-
 News
News17/09/2026
Efor opens a new office in Amsterdam, the Netherlands
Efor is continuing its northern europe development with the opening of a new office in the Netherlands.
-
 Press releases
16/09/2026
Efor expands into the Netherlands to accelerate growth in Northern Europe
Efor is continuing its international development with the opening of a new office in the Netherlands, at the heart of one of Europ